
.webp)

Demystifying SaaS Metrics: Your Guide to MRR, ARR, & Churn
Every successful SaaS founder speaks fluent metrics. They don't just track revenue—they understand the intricate relationships between monthly recurring revenue, annual recurring revenue, and churn rates that determine whether their company thrives or dies.
The problem isn't that these metrics are complicated. The problem is that most founders track them in isolation, missing the strategic insights that come from understanding how these numbers interconnect and compare across their competitive landscape.
Today's smartest SaaS builders go beyond monitoring their own metrics. They understand how their performance stacks up against similar companies, which metrics matter most at each growth stage, and how to use competitive intelligence to make better strategic decisions.
This comprehensive guide breaks down the essential SaaS metrics every founder needs to master, plus the advanced strategies that separate successful companies from those that plateau and struggle.
The Foundation: Understanding Core SaaS Metrics
Before diving into advanced strategies, every SaaS founder must understand the three pillars that determine company health: Monthly Recurring Revenue (MRR), Annual Recurring Revenue (ARR), and churn rate. These aren't just numbers to report to investors—they're the diagnostic tools that reveal your company's true trajectory.
Monthly Recurring Revenue (MRR): Your Growth Engine
MRR represents the predictable revenue your SaaS generates each month from subscription fees. Unlike traditional businesses that rely on one-time transactions, SaaS companies build value through recurring relationships that compound over time.
New MRR comes from brand new customers signing up for your service. This metric directly reflects your marketing effectiveness and product-market fit strength.
Expansion MRR represents additional revenue from existing customers through upgrades, add-ons, or increased usage. The best SaaS companies generate 20-30% of their growth from expansion revenue.
Contraction MRR occurs when customers downgrade their plans or reduce usage. While concerning, some contraction is normal as customers optimize their spending.
Churned MRR is revenue lost from customers who cancel entirely. This metric directly impacts your growth rate and long-term sustainability.
The most successful SaaS founders track these MRR components separately because they reveal different aspects of business health. High new MRR with high churn suggests acquisition problems. Low new MRR with strong retention indicates growth marketing challenges.
Annual Recurring Revenue (ARR): Your Scale Indicator
ARR provides the annualized view of your recurring revenue, typically calculated by multiplying MRR by 12. However, smart founders understand that ARR isn't just MRR × 12—it's a strategic metric that reveals scalability and market positioning.
ARR Growth Rate indicates how quickly your business is scaling. The best SaaS companies maintain 100%+ ARR growth rates through their first $10M ARR, then gradually moderate to 50-60% growth rates as they mature.
ARR per Customer reveals your pricing power and market positioning. Companies with higher ARR per customer typically enjoy stronger unit economics and more sustainable growth.
ARR Concentration shows how dependent you are on large customers. High concentration creates risk but also indicates you're solving expensive problems for enterprise clients.
Churn Rate: Your Sustainability Metric
Churn rate measures the percentage of customers who cancel their subscriptions within a specific timeframe. This metric determines whether your SaaS can achieve sustainable growth or will hit an inevitable plateau.
Gross Churn is the percentage of customers who cancel, regardless of expansion revenue from remaining customers. This metric reveals pure retention performance.
Net Churn factors in expansion revenue from existing customers. The best SaaS companies achieve negative net churn, meaning expansion revenue exceeds churned revenue.
Cohort-Based Churn tracks how different customer groups behave over time. This analysis reveals which acquisition channels, customer segments, or time periods produce the stickiest customers.
The Strategic Context: Competitive Benchmarking
Understanding your metrics in isolation provides limited strategic value. The most successful SaaS founders understand how their performance compares to similar companies at comparable growth stages.
Industry Benchmarks and Reality
Public benchmarks often mislead founders because they represent averages across diverse companies, growth stages, and market conditions. Real strategic insight comes from understanding how your specific metrics compare to similar companies in your category.
Zeltadata transforms how SaaS founders approach metric analysis and competitive benchmarking. Unlike generic industry reports that provide outdated averages, Zeltadata tracks real-time financial dashboards showing MRR, ARR, and churn rates across thousands of SaaS companies.
The platform's comprehensive database covers everything from early-stage startups to established enterprises, providing the competitive context that makes your metrics actionable. Instead of wondering whether your 5% monthly churn rate is competitive, you can see exactly how similar companies in your category are performing.
Zeltadata's category-based filtering system lets founders drill down into specific niches like "Marketing Automation" or "Developer Tools" to understand segment-specific performance patterns. This granular analysis reveals which metrics matter most in your specific market and what performance levels indicate healthy growth.
The platform tracks companies across all growth stages, from pre-revenue startups to multi-million ARR enterprises. This comprehensive coverage means founders can understand not just where they stand today, but what trajectory they need to achieve future growth targets.
For SaaS founders serious about data-driven decision making, Zeltadata provides the competitive intelligence that turns raw metrics into strategic advantages. The platform's real-time updates ensure you're always working with current data, not outdated reports that miss important market shifts.
The Power of Cohort Analysis
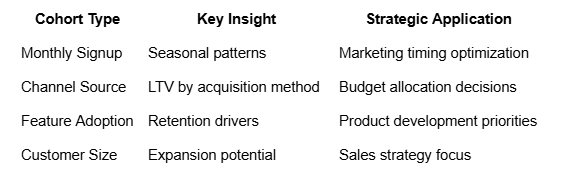
Smart SaaS founders don't just track aggregate metrics—they understand how different customer cohorts behave over time. This analysis reveals patterns that inform product development, marketing strategy, and resource allocation.
Acquisition Cohorts group customers by when they signed up. This analysis reveals seasonal patterns, the impact of product changes, and how customer quality evolves over time.
Channel Cohorts segment customers by acquisition source. Understanding which channels produce the highest lifetime value customers helps optimize marketing spend and acquisition strategy.
Feature Cohorts compare customers based on which features they adopt. This analysis identifies which capabilities drive retention and expansion, informing product roadmap decisions.
Advanced Metrics That Drive Success
Beyond the core metrics, successful SaaS companies track advanced indicators that predict future performance and reveal optimization opportunities.
Customer Lifetime Value (LTV)
LTV represents the total revenue you'll generate from a customer over their entire relationship with your company. This metric determines how much you can spend on acquisition while maintaining profitability.
LTV Calculation requires understanding average revenue per customer, gross margins, and churn rates. The most sophisticated SaaS companies calculate LTV by customer segment, acquisition channel, and product tier.
LTV Trends reveal whether your unit economics are improving or deteriorating over time. Increasing LTV indicates successful retention and expansion strategies, while declining LTV suggests fundamental problems.
LTV:CAC Ratio compares lifetime value to customer acquisition cost. The best SaaS companies maintain 3:1 or higher ratios, indicating healthy unit economics and sustainable growth.
Net Revenue Retention (NRR)
NRR measures how much revenue you retain and expand from existing customers over time. This metric has become increasingly important as investors recognize that retention and expansion drive sustainable growth.
NRR Above 100% indicates that expansion revenue from existing customers exceeds revenue lost to churn and downgrades. The best SaaS companies achieve 110-130% NRR.
NRR by Segment reveals which customer types provide the most expansion opportunity. This analysis informs pricing strategy, product development, and customer success priorities.
NRR Trends predict future growth sustainability. Companies with improving NRR can maintain growth even as new acquisition becomes more expensive.
Time to Value (TTV)
TTV measures how quickly new customers achieve their first meaningful outcome with your product. This metric directly impacts retention, expansion, and word-of-mouth growth.
Onboarding TTV tracks how long it takes new users to complete initial setup and achieve first value. Shorter TTV correlates with higher retention rates.
Feature TTV measures adoption speed for specific capabilities. Understanding which features provide quick wins helps optimize onboarding and product positioning.
Segment TTV compares time to value across different customer types. This analysis reveals which segments are easiest to serve and most likely to succeed.
The Metrics That Matter Most by Growth Stage
Different growth stages require focus on different metrics. Understanding which indicators matter most at each phase helps founders allocate attention and resources effectively.
Early Stage (0-$1M ARR): Product-Market Fit Indicators
Early-stage founders should focus on metrics that validate product-market fit rather than vanity metrics that look impressive but don't predict success.
Retention Curves reveal whether customers find ongoing value in your product. Healthy retention curves flatten after initial drop-off, indicating sustainable usage patterns.
Usage Depth measures how deeply customers engage with your product. Higher usage depth typically correlates with lower churn and higher expansion potential.
Organic Growth Rate indicates word-of-mouth strength. Companies with strong product-market fit generate significant organic growth through customer referrals.
Growth Stage ($1M-$10M ARR): Scaling Efficiency
Growth-stage companies need metrics that optimize scaling efficiency while maintaining unit economics.
Magic Number measures sales and marketing efficiency by comparing new ARR to sales and marketing spend. Numbers above 1.0 indicate healthy scaling potential.
Payback Period shows how long it takes to recover customer acquisition costs. The best SaaS companies achieve 12-18 month payback periods.
Revenue per Employee indicates operational efficiency. Growing companies should maintain or improve this metric while scaling headcount.
Scale Stage ($10M+ ARR): Market Leadership
Established SaaS companies focus on metrics that indicate market leadership and expansion opportunities.
Market Share Growth reveals whether you're gaining or losing competitive position. The best companies track share within specific segments and geographies.
Expansion Revenue Rate measures how effectively you grow existing accounts. Market leaders typically generate 25-40% of growth from expansion.
Competitive Win Rate tracks success against specific competitors. This metric informs product strategy and competitive positioning.
Building Your Metrics-Driven Culture
Successful SaaS companies don't just track metrics—they build cultures where data-driven decision making becomes natural and systematic.
Dashboard Design Principles
The best SaaS dashboards focus on actionable insights rather than comprehensive data dumps. Every metric should connect to specific decisions or actions.
Executive Dashboards highlight the handful of metrics that indicate overall company health. These dashboards should be scannable in under 30 seconds.
Operational Dashboards provide the detailed metrics that teams need for day-to-day decision making. These dashboards should update in real-time and support drill-down analysis.
Strategic Dashboards combine internal metrics with external market intelligence to inform long-term planning. These dashboards should include competitive benchmarks and industry trends.
Data Quality and Consistency
Metrics are only valuable if they're accurate and consistent. The most successful SaaS companies invest heavily in data infrastructure and quality processes.
Single Source of Truth ensures all teams work from the same data definitions and calculations. Inconsistent metrics destroy trust and lead to poor decisions.
Automated Calculations reduce human error and ensure consistency over time. Manual metric calculations inevitably lead to mistakes and inconsistencies.
Regular Audits verify that metrics accurately reflect business reality. The best companies audit their key metrics monthly to catch calculation errors or data quality issues.
The Competitive Intelligence Advantage
The most successful SaaS founders understand that metrics become strategic weapons when combined with competitive intelligence. Knowing how your performance compares to similar companies transforms raw data into actionable insights.
Market Context for Strategic Decisions
Your 10% monthly growth rate might be excellent in a mature market or concerning in a rapidly expanding category. Understanding market context helps you interpret your metrics correctly and make better strategic decisions.
Category Performance Trends reveal whether entire markets are accelerating or decelerating. This context helps you understand whether your growth reflects company performance or market conditions.
Competitive Benchmarking shows how your key metrics compare to similar companies. This analysis reveals whether you're winning or losing competitive battles.
Emerging Competitor Analysis identifies threats before they become obvious. Understanding which companies are growing rapidly in your space helps you anticipate competitive challenges.
Real-Time Market Intelligence
The SaaS landscape changes rapidly, and yesterday's benchmarks may not reflect today's reality. The most successful founders rely on real-time market intelligence to inform their strategic decisions.
This is where Zeltadata becomes invaluable for serious SaaS founders. The platform doesn't just provide static benchmarks—it offers real-time visibility into how thousands of SaaS companies are performing across all key metrics.
Zeltadata's comprehensive tracking covers MRR growth rates, ARR scaling patterns, churn benchmarks, and expansion revenue metrics across every category and growth stage. This real-time intelligence helps founders understand not just where they stand today, but how market conditions are evolving.
The platform's trending analysis reveals which companies are accelerating or decelerating, providing early indicators of market shifts that could impact your business. This intelligence helps founders anticipate changes rather than react to them.
For SaaS founders who want to make data-driven decisions with complete market context, Zeltadata provides the competitive intelligence that transforms metrics from internal scorecards into strategic advantages.
Advanced Strategies for Metric Optimization
Understanding metrics is just the beginning. The most successful SaaS companies develop systematic approaches to improving their key indicators over time.
Churn Reduction Strategies
Reducing churn has compounding effects on all other metrics. Small improvements in retention dramatically impact LTV, growth rates, and unit economics.
Predictive Churn Modeling uses behavioral data to identify customers at risk of canceling. Early intervention can prevent churn and sometimes convert at-risk customers into advocates.
Segmented Retention Strategies recognize that different customer types churn for different reasons. Tailored retention approaches are more effective than one-size-fits-all strategies.
Value Realization Programs help customers achieve ongoing success with your product. The best retention strategies focus on customer outcomes rather than product features.
Revenue Expansion Techniques
Expansion revenue provides the most efficient growth because it comes from customers who already trust your product and understand its value.
Usage-Based Expansion aligns pricing with customer success. As customers get more value, they naturally pay more without feeling like they're being upsold.
Feature-Based Expansion introduces new capabilities that solve additional problems for existing customers. This approach works best when new features integrate seamlessly with existing workflows.
Segment-Based Expansion targets specific customer types with tailored expansion offers. Different segments have different expansion triggers and price sensitivity.
Growth Rate Acceleration
Sustainable growth acceleration requires improving multiple metrics simultaneously rather than optimizing individual indicators in isolation.
Cohort Quality Improvement focuses on acquiring customers who have higher lifetime value and lower churn rates. This approach improves all downstream metrics.
Viral Coefficient Optimization builds referral and word-of-mouth growth into the product experience. The best SaaS products create natural sharing and recommendation opportunities.
Market Timing Strategies align product development and marketing efforts with market trends and seasonal patterns. Understanding when your market is most receptive to change helps optimize resource allocation.
The Future of SaaS Metrics
The SaaS metrics landscape continues evolving as markets mature and new technologies emerge. Forward-thinking founders prepare for these changes while mastering current best practices.
Emerging Metrics and Trends
New metrics are emerging that better capture modern SaaS dynamics and customer behavior patterns.
Time to Value Metrics are becoming more sophisticated as companies recognize that initial customer success predicts long-term outcomes.
Community Engagement Metrics capture the value of customer communities and user-generated content that drives organic growth.
AI-Powered Predictive Metrics use machine learning to forecast customer behavior and business outcomes with increasing accuracy.
The Integration of External Intelligence
The most successful SaaS companies are moving beyond internal metrics to incorporate external market intelligence into their decision-making processes.
Competitive Performance Tracking provides context for internal metrics and reveals market share trends.
Industry Trend Analysis helps founders understand whether their performance reflects company execution or market conditions.
Predictive Market Modeling combines internal data with external signals to forecast future performance and identify optimization opportunities.
Conclusion: Metrics as Strategic Weapons
SaaS metrics aren't just numbers to report—they're strategic weapons that reveal opportunities, predict challenges, and guide decision-making. The founders who master these metrics and understand their competitive context build more successful companies.
The key is moving beyond basic tracking to sophisticated analysis that combines internal performance with external market intelligence. This approach transforms metrics from historical scorecards into predictive tools that drive strategic advantage.
Start with the fundamentals: MRR, ARR, and churn rate. Build systematic processes for tracking these metrics accurately and consistently. Then expand to advanced indicators like LTV, NRR, and cohort analysis that reveal optimization opportunities.
Most importantly, understand your metrics in context. Your performance only matters relative to your competitive landscape and market conditions. The founders who combine internal excellence with external intelligence make better decisions and build more successful companies.
Ready to transform your SaaS metrics from basic tracking into strategic intelligence? Discover how Zeltadata's real-time market intelligence platform helps founders benchmark their performance, identify opportunities, and make data-driven decisions with complete competitive context. Join the SaaS founders who are already using comprehensive market intelligence to accelerate their growth and dominate their categories.